How a few accounts shaped the Nextdoor conversation
Summary
Five Nextdoor accounts, 3.5% of the 142 that took part, wrote 40% of the 623 resident posts and comments on Town Councilmember Pat Ravasio, the Alta Woods driveway, the Brown Act investigation and the town manager between Aug 19 and Oct 21, 2026.
- Volume: the 14 most active accounts (10%) wrote 61.5% of all items. 79 accounts (56%) posted once.
- Criticism: 338 items criticized the Councilmember, written by 54 accounts. The five most critical accounts wrote 57% of them.
- Support: 31 items from 19 accounts defended the Councilmember, about 1 for every 11 critical items. The other 254 items were neutral, about other issues, or unclear.
- Incivility: 82 items (13%) contained insults, mocking nicknames or attacks on character. 22 accounts wrote them; five wrote 67%. 60 of the 82 were aimed at elected officials or candidates.
- Reach: the five most active accounts appeared in 35 of 37 resident-started threads, started 18 of them, and drew 42% of all reactions.
A reader scrolling these threads sees the same few voices again and again, which makes a view held by a handful of accounts look like the view of the neighborhood.
What was measured
The data covers every post and comment in 40 Nextdoor threads on these topics that one Corte Madera resident account could see, dated Aug 19 to Oct 21, 2026. That is 626 items, 623 from residents and 3 from the Town's official account.
- Searches: the Councilmember's name with variants and misspellings, Brown Act, Adam Wolff, Corte Madera Property Trust, Alta Woods, 800 Corte Madera, the driveway appeal, and Corte Madera Town Council.
- Coding: each item was coded for stance toward the Councilmember, main topic, and incivility. Incivility means insults, mocking nicknames, demeaning remarks on character, age or looks, or attacks on another commenter's motives. Harsh criticism of votes or fitness for office ("should resign") was not counted. The same rule was applied to every side and every target.
- Privacy: no names appear in this report. Authors were replaced with numbered labels, and Nextdoor neighborhood labels are reported only in totals.
- Date range: the driveway dispute began with the trust's permit application well before August 2026, but Nextdoor search returned nothing on these topics older than Aug 19, 2026. The earlier period, and the town's record of civil public debate before it, cannot be measured from this data.
Concentration
A handful of accounts carried the conversation, while most participants spoke once and left. Hover over or tap any bar for its numbers. On a phone, swipe sideways inside a chart to see all of it.
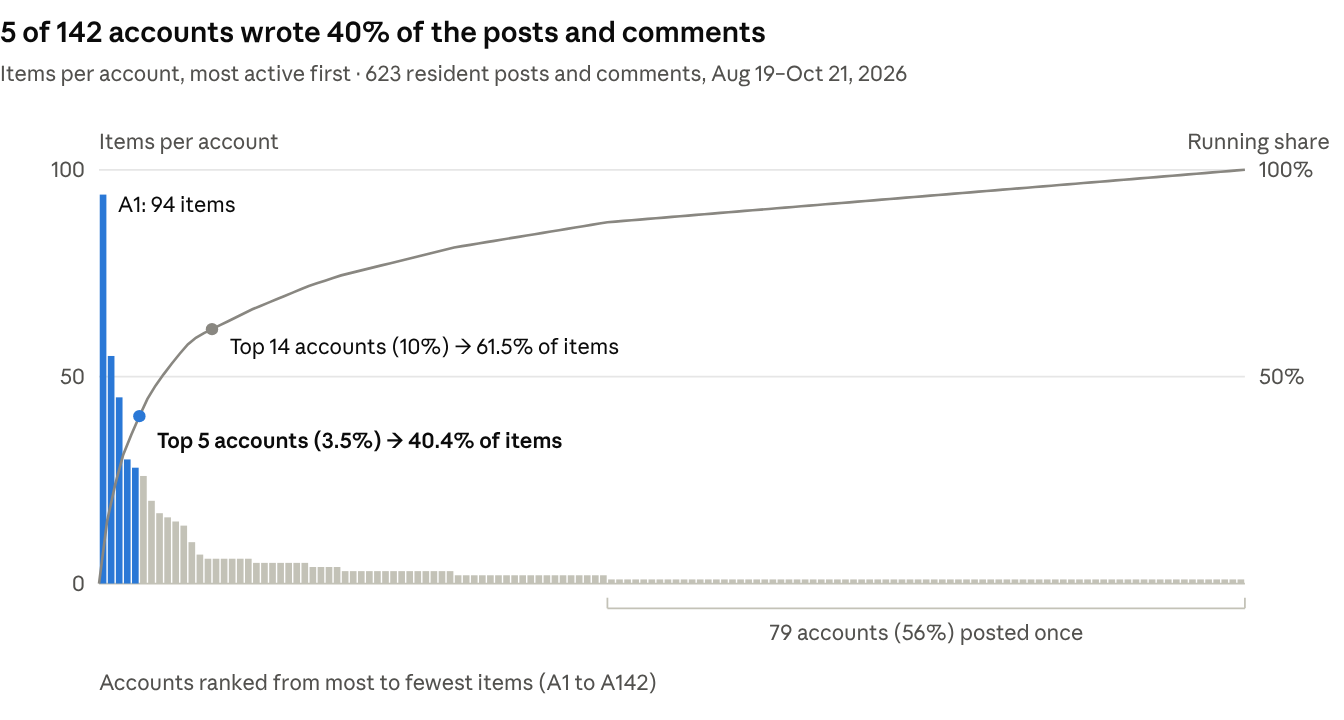
The grey line is the running share: reading left to right, it shows how much of the conversation the accounts so far had written. It passes 40% after five accounts and 61.5% after fourteen.
Criticism and incivility
Criticism of the Councilmember came from 54 accounts, but incivility came from far fewer: 22 accounts wrote all 82 uncivil items, and the five most active accounts wrote 47 of them.
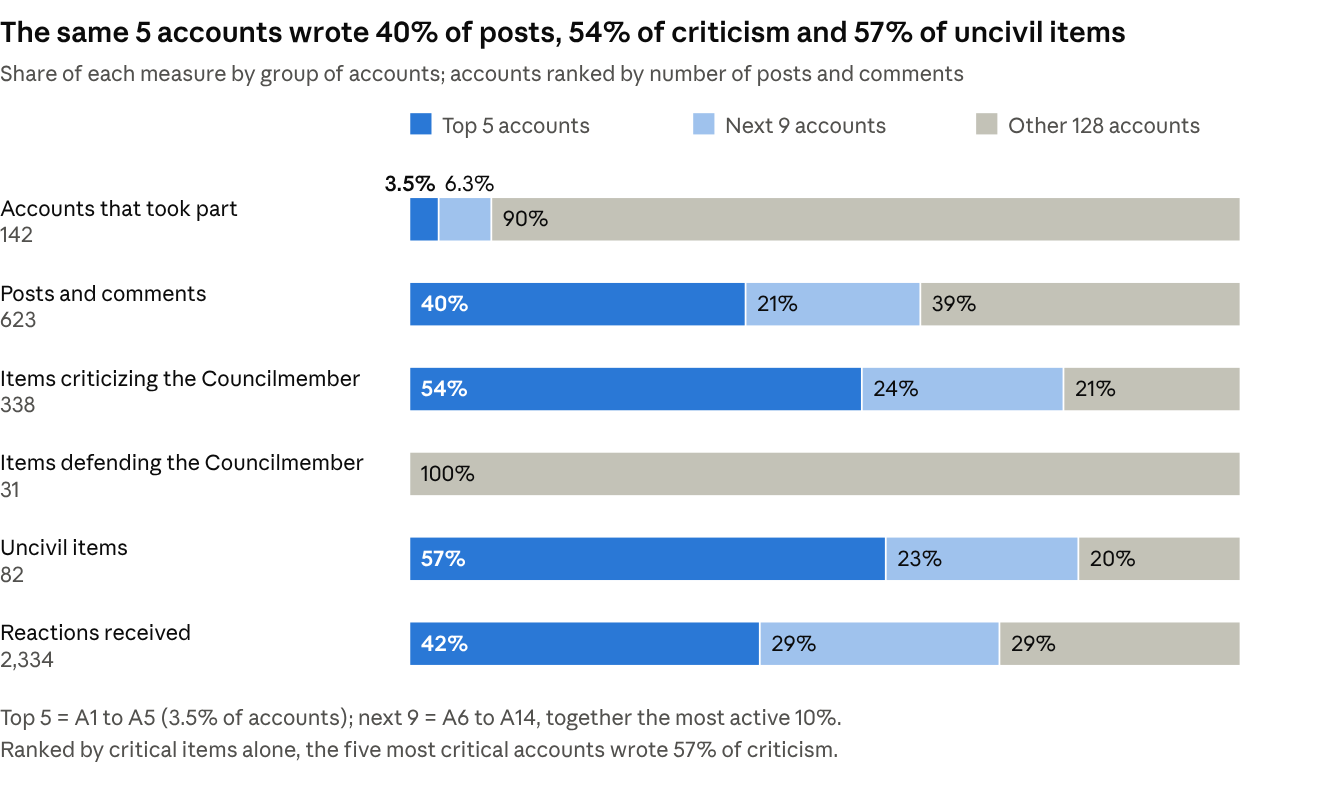
- Who was targeted: 60 uncivil items were aimed at elected officials or candidates, 16 at other residents, 4 at the Alta Woods property owners and 2 at the press.
- Which side: 62 uncivil items were in posts critical of the Councilmember, 19 in neutral or other items, and 1 in an item defending her. Incivility toward property owners and fellow residents appeared on more than one side of the driveway dispute.
- Few defenders posted: 31 items from 19 accounts defended the Councilmember: 1 post and 30 comments. None came from the 14 most active accounts. Supportive items drew 29 reactions in all, against 1,755 for critical items.
Timeline
The conversation came in bursts rather than a steady stream: two weeks produced 59% of all items, and the same five accounts led both.
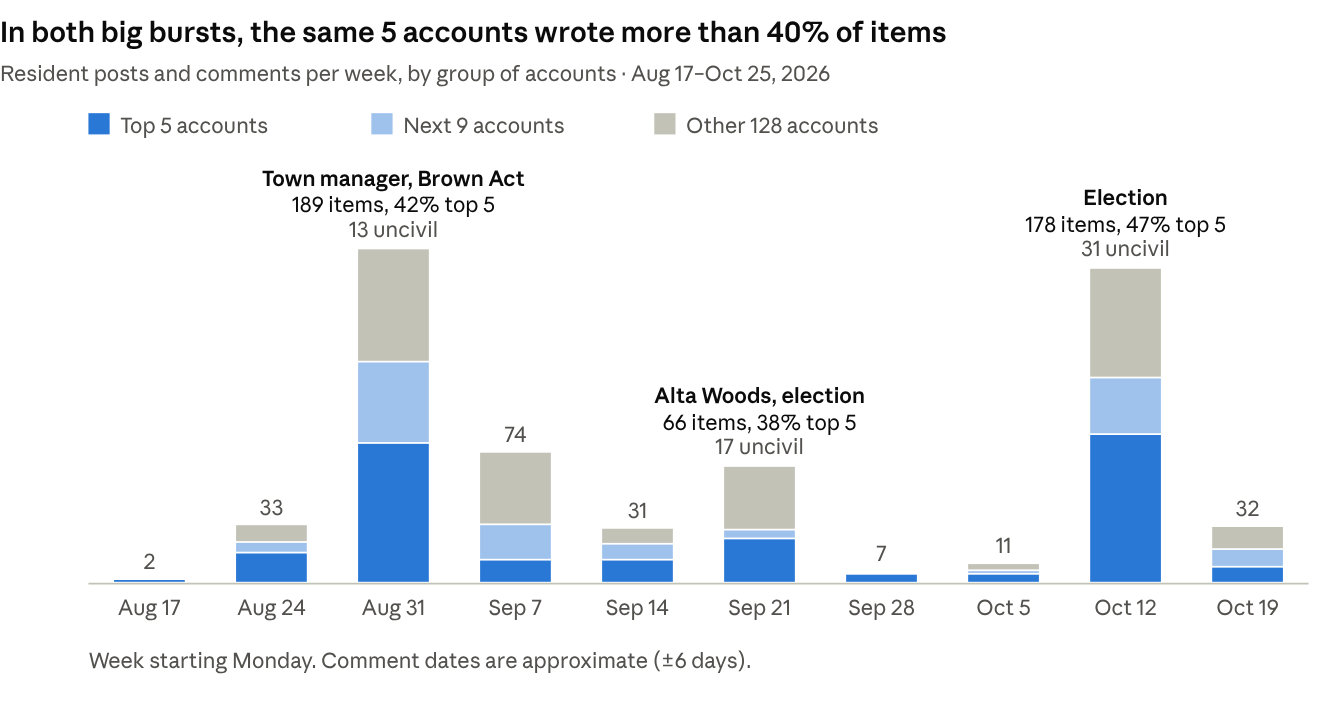
Uncivil items peaked in the week of Oct 12, with 31 items as the election neared; 23 of them came from the five most active accounts.
Neighborhoods
Christmas Tree Hill accounts wrote 41% of all items, but 70% of that neighborhood's volume came from three accounts. The pattern repeats across neighborhoods: in each, a few residents did most of the talking.
| Nextdoor neighborhood label | Accounts | Items | Share of all items | Share written by its 3 most active accounts | Uncivil items |
|---|---|---|---|---|---|
| Christmas Tree Hill | 26 | 254 | 41% | 70% | 43 |
| Chapman Park | 25 | 135 | 22% | 57% | 17 |
| Old Town | 7 | 56 | 9% | 89% | 10 |
| Mariner Cove | 11 | 46 | 7% | 72% | 2 |
| Madera Gardens | 12 | 21 | 3% | 52% | 0 |
| 48 other labels | 61 | 111 | 18% | — | 10 |
Neighborhoods are shown only in totals. Labels with very few accounts are grouped, so no single resident can be picked out.
Why a few accounts skew perception
Research on social media finds the same pattern seen here: a small share of users produces most of the content and nearly all of the hostile content, and readers mistake it for the general mood.
- Volume is concentrated. The most active 10% of U.S. adult Twitter users produced 80% of tweets, with a median of 138 tweets a month against 2 for everyone else. Their views differed only modestly from other users; their posting habits differed a lot (Pew Research Center, 2019). In Corte Madera's threads, the most active 10% of accounts wrote 61.5%.
- Hostility is overestimated. Only 3.1% of Reddit accounts posted severely toxic comments, yet Americans estimated about 41%, a roughly 13-fold overestimate. When people learned the real figure, they felt more positive and saw less moral decline in their fellow citizens (Lee, Neumann, Zaki & Hancock, PNAS Nexus, 2025). Here, 22 of 142 accounts (15%) wrote every uncivil item.
- Outrage looks bigger than it is. Readers judged posters to be angrier than the posters said they felt. After seeing outrage-heavy feeds, people believed users in general were more outraged and rated outrage as more acceptable (Brady et al., Nature Human Behaviour, 2023).
- Local officials feel it. In a 2024 survey of 256 mayors, council members and city managers, 73% reported harassment. Of those, 89% experienced it on social media and 84% at public meetings; almost 60% said it had worsened since they took office (National League of Cities, 2024).
What the data does not show
The numbers show concentration of posting, not coordination, motive, or who is right about the dispute.
- No evidence of coordination. Several active accounts posting on the same side is consistent with organized effort and with independently motivated neighbors. Nothing here tells them apart.
- Volume is not opinion. Posting counts measure behavior on one platform, not how many residents hold a view. Most residents never post.
- One account's view. Nextdoor shows each member a different mix of neighborhoods and groups. Removed or hidden posts are not included.
- Coder judgment. One person coded stance and incivility, with no second-coder check. The coding rules are written down so others can re-check them.
- No baseline before August 2026. Nextdoor search did not return older posts, so this data cannot show whether discourse was more civil earlier. Council meeting minutes, video and written public comment from 2024 onward could supply that comparison.
- Approximate dates. Comments show only a relative age ("2w"), so their dates can be off by up to six days.
Sources
- Nextdoor posts and comments, read Oct 20–22, 2026
- Pew Research Center: Sizing Up Twitter Users (Apr 24, 2019)
- Lee, Neumann, Zaki & Hancock: Americans overestimate how many social media users post harmful content, PNAS Nexus 4(12), 2025
- Brady et al.: Overperception of moral outrage in online social networks inflates beliefs about intergroup hostility, Nature Human Behaviour, 2023 (Northwestern summary)
- National League of Cities: 73% of Local Officials Report Experiencing Harassment (Sept 18, 2024)